10 Reasons You Need to Create a Cool Infographic

Content marketing isn’t just about blogging. In fact, there’s a lot of compelling evidence that your inbound marketing strategy should include plenty of visual content. One of the hottest types of content at the moment is cool infographics: easy-to-consume, visual representations of data and concepts. Copywriting expert Barry Feldman reports that demand for infographics on the web increases 1% each day! And why not, really – infographics are perfectly viral-ready. They’re easily-packaged, bite-sized bits of information in a gorgeous visual format. If you’re considering joining the ranks of cool infographic creators, consider the following evidence.
1. They’re Easier to Consume
Did you know that 90% of the information transmitted to the human brain is visual? Or that 45% of humans simply respond to visuals better than plain text? It’s clear that there’s some science behind the fact that, as Feldman puts it, “people love [infographics.]…they save them. They rave about them. Most importantly, they actually share them.” Research has discovered that high-quality infographics are 30 times more likely to be read than text-based blogs and articles.
2. Their Popularity Continues to Increase
Don’t listen to anyone who tells you that infographics are “so 2012.” In fact, data from Google alerts indicates that demand for infographics as measured by search queries has steadily increased over the past several years, and is currently 10x higher than it was in 2005.
3. They’re SEO Gold
Few items are more primed for inclusion in a content curation strategy than infographics. Your site can reap SEO dividends, particularly if you opt to include embed code for other content marketers. Besides, as marketing blogger Fernando Biz points out, many of the links generated from infographic creation are highly relevant, due to the highly-targeted nature of this type of content. Blog posts which include visual content, like cool infographics, receive 567% more inbound links than articles which consist only of text.
4. They’re Effective Audience-Builders
Consumers who stumble across your company website by following a link to your cool infographic won’t all become leads and customers. But some will, and you could find your blog marketing metrics continue to skyrocket after the first time you create an infographic. Studies by Anson Alex have found that publishers who use infographics grow their traffic 12% faster than those that don’t.

5. They Work for Everyone
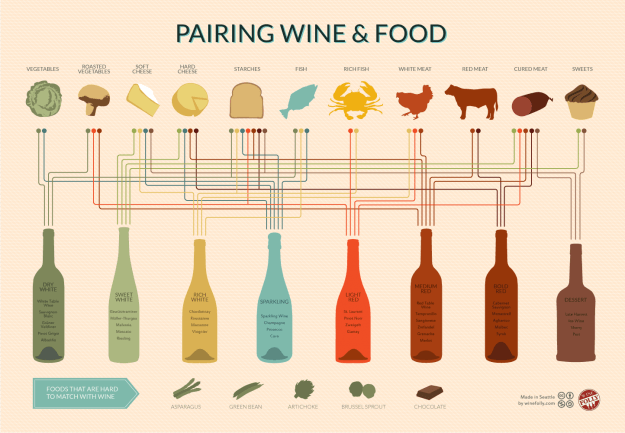
Many of the most viral cool infographics are depictions of recently-released data, or other trending concepts. However, there’s no reason that you can only create an infographic if you’re in a rapidly-changing field, like marketing or technology. Most complex concepts are actually best relayed through visual forms. For inspiration, check out this cool infographic from Wine Folly on pairing food and drink:

6. They’re Perfectly Shareable
As search engines continue to place an increasing amount of weight on social signals, the idea that Facebook posts, Tweets, +1s and Pins can help gauge the relevance and quality of content, focusing your content marketing strategy on stuff that people want to share is just plain smart. In a recent month, the word infographic was published on Twitter an astounding 56,765 times, serving as clear evidence that deciding to create an infographic can be a surefire path to increased exposure on major social media networks.
7. Pinterest Users Love Infographics
There are few networks better-optimized for infographics than Pinterest, where visually-rich, vertical images have been shown to out-perform other pins. Deciding to create an infographic can provide your company with extensive exposure on Pinterest, which carries the benefit of having incredibly high user engagement. 10% of Pinterest users log into their accounts multiple times a day, and the site is more effective at driving referral traffic to businesses than Google+, YouTube, and LinkedIn combined.
8. They’re More Memorable
Did you know that only 80% of information consumed on a daily basis isn’t retained? Or that the human brain filters out over 99% of sensory information? The sheer volume of content and information which surrounds the modern consumer on a daily basis is positively overwhelming, and we’ve all developed coping tactics to avoid being flooded with blogs and social media posts. Conversion expert Oli Gardner believes that infographics are often among the top 1% of information which humans aren’t yet conditioned to ignore. While text is processed in a distinct sequence, the eye can categorize and contextualize visuals immediately, meaning your cool infographics are far less likely to be ignored or forgotten in the end.
9. They Can Be Recycled and Re-Promoted
Infographics aren’t always the right dimensions to be promoted on Google+ and Facebook. When shared in their entirety, long cool infographics can become quite difficult to read. However, cropping portions of your final product to share on Facebook and other networks as educational, standalone images can allow you to receive mileage long after the initial glow of deciding to create an infographic has faded.
10. They’re Probably Much Easier than You Think
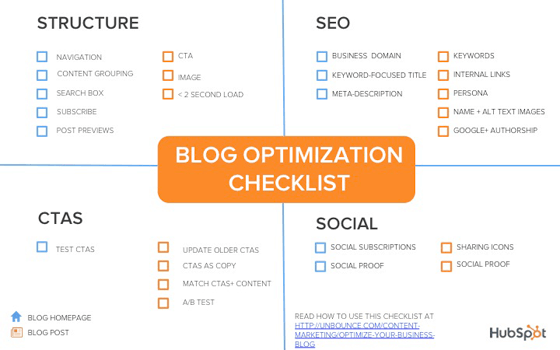
If I had to wager a guess, I’d say the only thing holding most content creators back from deciding to create an infographic is fear or misunderstanding. To be clear, you don’t need a full subscription to the Adobe Creative Suite or years of graphic design experience to make a cool infographic that earns viral sharing and heaps of attention. All you need is a great concept, and access to one of many platforms. Check out the amazing and ready-to-use cool infographic which Lindsey Kirchoff of HubSpot designed in Microsoft PowerPoint:

There are tons of options for infographic creation for designers of all skill levels, many of which are free. For more ideas, check out 45 Free or Super Cheap Tools for Visual Content Creation.
Do you create cool infographics as part of your content marketing strategy? What are the primary reasons you decided to create an infographic? Share your thoughts in the comments – we can’t wait to discuss!

Comments (0)